Active program runs heartbeat
- Chengfeng Mao
- Shankar Selvam
Checklist
- User Stories Documented
- User Stories Reviewed
- Design Reviewed
- APIs reviewed
- Release priorities assigned
- Test cases reviewed
- Blog post
Introduction
In Ops Dashboard, when a user selects a certain time range within the last 7 days, we want to display the statistics and information about the program runs that were running within that selected time range. However, existing program run meta data cannot allow such query for active program runs to be done efficiently as discussed in detail in https://wiki.cask.co/display/CE/Performance+improvement+for+getting+active+program+runs+within+a+time+range+for+Ops+Dashboard This page documents the design for writing and reading active program runs efficiently with a given time range. The general idea is that when a program is actively running, the information about this run will be published periodically like heartbeat. When querying for the active runs within a time range, they will be retrieved from the heartbeat within the time range. The approach in this document is first proposed here: https://wiki.cask.co/display/CE/Performance+improvement+for+getting+active+program+runs+within+a+time+range+for+Ops+Dashboard#PerformanceimprovementforgettingactiveprogramrunswithinatimerangeforOpsDashboard-Approach3:Periodicallyemitmetricsforrunningprograms(proposedbyTerence)
Goals
This document will focus on defining the information published in active program run heartbeat, the mechanism of publishing and processing heartbeat, the write path and read path of the heartbeat, and the API for reading the heartbeat.
User Stories
- A user wants to get all the active program runs from 04/11/2017- 5PM till 04/17/2017 5PM in namespaces "ns1", "ns2" and "ns3"
Design
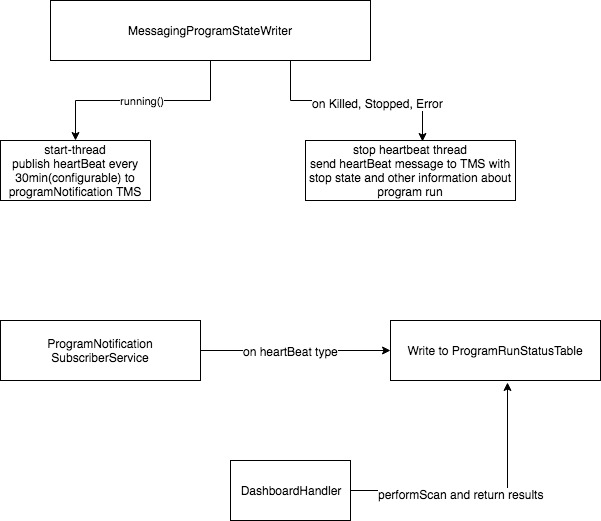
On MessagingProgramStateWriter#run, a scheduled service will be launched to send emitting heartbeat (configurable heartbeat interval , Default : 30minutes) to TMS periodically
On Completed/Killed/Error we stop the thread and also publish a message to the same TMS topic. Since the use-case need to support requests for "get completed runs in a time window".
Why TMS ?
Q: Why do we need to send the heart beat to TMS instead of writing directly to the Table ?
A: In CDAP-5.0, We have three different CDAP runtime, Distributed, Cloud and Sandbox. If we have to implement writing from program runtime to table directly, we need to have three different code path where we have to implement the logic and involves difficulty in maintaining them. Another concern is performance, If we start a thread in CDAP-master for each program to write heartbeat about the program, then we could quickly run into overloading the CDAP master with too many threads. However by enabling the CDAP programs to send heartbeat to TMS from the program runnnable, the work is distributed and there is only one unified place where the code for heartbeat emission has to happen. Simplifying implementation and maintenance.
It also handles the case where CDAP is down, however the programs in Distributed and Cloud could keep running, since these messages are sent to TMS, they could be processed by CDAP when it comes back up.
List of fields expected on a time range:
These information have to be encoded as part of the heartbeat message sent to the TMS from ProgramStateWriter.
| Field | Description |
|---|---|
| Namespace | available in ProgramRunId argument |
| Application Name, Program Name | available in ProgramRunId argument |
| Type of application (artifactId) | ProgramDescriptor passed to ProgramStateWriter#start - can be stored as a state in implementation |
| duration of run | - determined based on startTime - if program is still running on this time range, duration = time_window_end - startTime - if program is completed, duration = endTime - startTime - this requires storing the startTime state and propagating it in heartBeat messages |
| delay (running - start Time) | delay initialized when running is called first time in MessagingProgramStateWriter. |
| User | - user information is available as a part of system arguments - system arguments is part of ProgramOptions passed to ProgramStateWriter#start - store the arguments in a state and pass that information in heartbeat |
| Start Method (scheduled/triggered/manual) | similar to above, part of ProgramOptions |
| Program Status | can be derived from the method. |
Writing to Table
We will read from TMS topic, similar to the messages published about program status. but with a different type identifying the message as a heartbeat.
After reading heartbeat messages, it will be written to HBase table.
Table configuration:
Since the longest query time range for Ops dashboard will be 7 days, the table will have TTL a little longer than 7 days, such as one month. The table will be salted to avoid hotspot in region server in case of multiple records are written at the same time with the same prefix in rounded timestamp.
Row key design:
<message-timestamp>:<program-run-id>
where:
<message-timestamp>: the time when the message is published
<program-run-id>: app+program type+program+run
Value:
Notification : NotificationType, Properties : (Map of <String, String> or object including ProgramRunId, system arguments, ArtifactId, principal, startTime, runningTime, stopTime).
Reading from Table
Typical queries are scan table for a time range (1 hr or 12hr) for running and completed programs.
backend will scan and include rows in time range for the start and end time provided and respond to the user.
Scan and add the running programs to a set identified by programRunId (more than one heartbeat message in a time range)
If the program runid is stopped in the time-window, then it will be filtered out of running programs list and added to the completed programs list else it will be in the running programs list.
Edge cases will be considered where a program is suspended and started in the same time window during implementation.
Finally these two collection will be merged and sent as response to the user.
----------------
Archive
Approach
Sending heartbeat from ProgramRuntimeService
When ProgramRuntimeService starts a program run (or when a program starts running?), a scheduled service will be launched to send messages to TMS containing ProgramRunId, user overrides, system overrides, ProgramDescriptor, and the time when the message is published. A listener will be attached to the ProgramController so that when the program run is stopped, the scheduled service will also be shutdown. Before the scheduled service is shutdown, a final message will be sent to the heartbeat topic for this run to as the final hearbeat of the program run regardless of the schedule.
Since there is heartbeat sent at the start of the program run and another at the end of the program run, the frequency of sending the heartbeat just can be as small as possible to minimize the storage space in ActivePrgoramRunStore, but also guarantee that the heartbeat emitted by such program run will be included in the query time range. Assume given a query time range [query_begin_time, query_end_time) the minimum difference (query_end_time - query_begin_time) is T, then the frequency of sending heartbeat is every T/2 according to Nyquist frequency https://en.wikipedia.org/wiki/Nyquist_frequency In the ops dashboard use case, the smallest duration of the time range will be 12 hours, so heartbeats will be written every 6 hours. As shown in the graph below, by sending heartbeat at such frequency, at least one heartbeat is guaranteed to be included in the query time range.
          query_begin_time           query_end_time
               |                       |
------------------------------------------------------------> t
        |          |            |            |       |
run1:  start     hb1           hb2         hb3       stop


            |          |            |      |
run2:      start     hb1           hb2    stop


* hb: heartbeat
Even if there is no such minimum query time range constraint, we can still get all the active runs given heartbeat are sent every N seconds, by looking ahead of the query_begin_time by [N - (query_end_time - query_begin_time)] when getting the active records as shown in the graph below:
In case 1, even though no heartbeat falls within the query time range, but by looking ahead of the query_begin_time, the initial heartbeat start will be found.
In case 2, a heartbeat can be found in the query time range, even though looking ahead of the query_begin_time hasn't reached any heartbeat.
1.
                              query_begin_time   query_end_time
      |<-------------- delta  ---------|             |
----------------------------------------------------------------------------------------------------> t (s)
            |<---------------       N      -------------------->|            |
run1:       start                                               hb         stop


2.
                      query_begin_time      query_end_time
               |<--- delta -----|             |
-----------------------------------------------------------------------------------------------------> t (s)
         |<----------     N  --------->|<----------     N  --------->|          |
run1:    start                         hb1                         hb2         stop

* delta = N - (query_end_time - query_begin_time)
* hb: heartbeat
ActiveProgramRunStore read/write path
Table configuration:
Since the longest query time range for Ops dashboard will be 7 days, the table will have TTL a little longer than 7 days, such as one month. The table will be salted to avoid hotspot in region server in case of multiple records are written at the same time with the same prefix in rounded timestamp.
Row key design:
<message-timestamp>:<namespace>:<program-run-id>
where:
<message-timestamp>: the time when the message is published
<namespace-id>: the namespace of the program run
<program-run-id>: app+program type+program+run
Value:
RunRecordMeta including ProgramRunId, system arguments, ArtifactId, principal, stop time if present, and etc.
New Programmatic APIs
/**
 * Store for the run records of active program runs in the history.
 *
 * The rowkeys are of the form:
 *
 * messageTimestamp|namespace|app|version|programtype|program|runid
 */
public interface ActiveProgramRunStore {


  /**
   * Get a list of program runs that were running between given start and end time in the given namespaces
   *
   * @param startTimeInSecs start time in seconds
   * @param endTimeInSecs end time in seconds
   * @param namespaces the namespaces to get the program runs from
   * @return program runs that were running between given start and end time.
   */
  List<RunRecordMeta> getRunningInRange(long startTimeInSecs, long endTimeInSecs, Set<NamespaceId> namespaces);
}
Security Impact
Will authorization be enforced on program level?
Test Scenarios
| Test ID | Test Description | Expected Results |
|---|---|---|
| 1 | Get active runs from 03/17/2017 10:35am - 10:35pm in namespace "ns2" | Only program runs that were running in that time range in namespace "ns2" will be returned |
Releases
Release 5.0.0
Related Work
Future work
Created in 2020 by Google Inc.