Debugging an Application in CDAP Sandbox
Any CDAP application can be debugged in the CDAP Sandbox by attaching a remote debugger to the CDAP JVM. To enable remote debugging:
Start the CDAP Sandbox with --enable-debug, optionally specifying a port (default is 5005).
The CDAP should confirm that the debugger port is open with a message such as Remote debugger agent started on port 5005.
Deploy (for example) the SportResults application to the CDAP by dragging and dropping the SportResults.jar file from the /examples/SportResults directory onto the CDAP UI.
Open the SportResults application in an IDE and connect to the remote debugger.
For more information, see Attaching a Debugger.
noteNote: Currently, debugging is not supported under Windows.
Note: Currently, debugging is not supported under Windows.
Debugging an Application in Distributed CDAP
In distributed mode, an application does not run in a single JVM. Instead, its programs are dispersed over multiple, if not many, containers in the Hadoop or Spark clusters. There is no single place to debug the entire application.
You can, however, debug every individual container by attaching a remote debugger to it. In order to debug a container, you need to start the component with debugging enabled by making an HTTP request to the component’s URL.
POST /v3/namespaces/default/apps/WordCount/spark/WordCounter/debug |
ing curl:
$ curl -w"\n" -X POST "http://<hostname>:11015/v3/namespaces/default/apps/WordCount/spark/WordCounter/debug" |
|
> curl -X POST "http://<hostname>:11015/v3/namespaces/default/apps/WordCount/spark/WordCounter/debug" |
|
Note that this URL differs from the URL for starting the program only by the last path component (debug instead of start; see the Lifecycle Microservices). You can pass in runtime arguments in the exact same way as you normally would start a program.
Once the program is running, you can find out the address of the containers' information, such as the host, port, and memory, by querying the t:
GET /v3/namespaces/default/apps/WordCount/spark/WordCounter/live-info
|
or, using the CDAP :
$ cdap cli get spark live WordCount.WordCounter |
|
> cdap cli get spark live WordCount.WordCounter |
|
Tesponse is formatted in JSON and, pretty-printed, would look similar to this:
{
  "app": "WordCount",
  "containers": [
    {
      "container": "container_1397069870124_0010_01_000002",
      "debugPort": 42071,
      "host": "node-1004.my.cluster.net",
      "instance": 0,
      "memory": 512,
      "name": "unique",
      "virtualCores": 1
    },
    ...
    {
      "container": "container_1397069870124_0010_01_000005",
      "debugPort": 37205,
      "host": "node-1003.my.cluster.net",
      "instance": 0,
      "memory": 512,
      "name": "splitter",
      "virtualCores": 1
    }
  ],
  "id": "WordCounter",
  "runtime": "distributed",
  "type": "spark",
  "yarnAppId": "application_1397069870124_0010"
} |
You see the YARN application id and the YARN container IDs, but more importantly, you can see the host name and debugging port. For example, for one of the containers, you see the host is node-1003.my.cluster.net and the debugging port is 37205. You can now attach your debugger to the container’s JVM
The corresponding HTTP requests for the RetrieveCounts service of this application would be:
POST /v3/namespaces/default/apps/WordCount/services/RetrieveCounts/debug
GET /v3/namespaces/default/apps/WordCount/services/RetrieveCounts/live-info |
Analysis of the response would give you the host names and debugging ports for all instances of the service.
Attaching a Debugger
Debugging with IntelliJ
Note: These instructions were developed with IntelliJ v13.1.2. You may need to adjust them for your installation or version. |
From the IntelliJ toolbar, select Run > Edit Configurations.
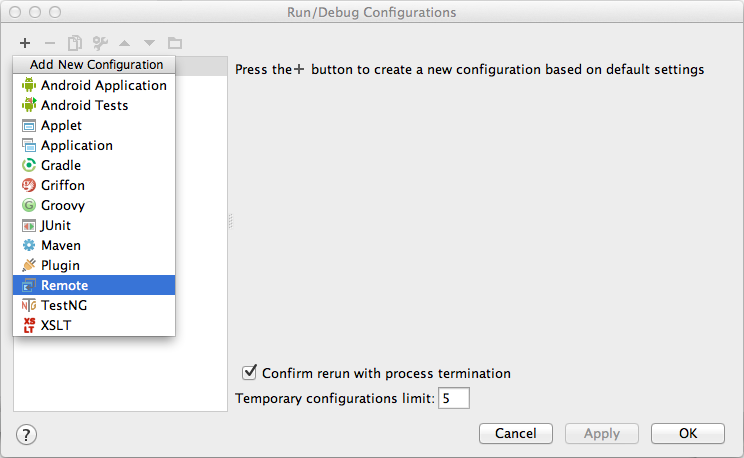
Click + and choose Remote:

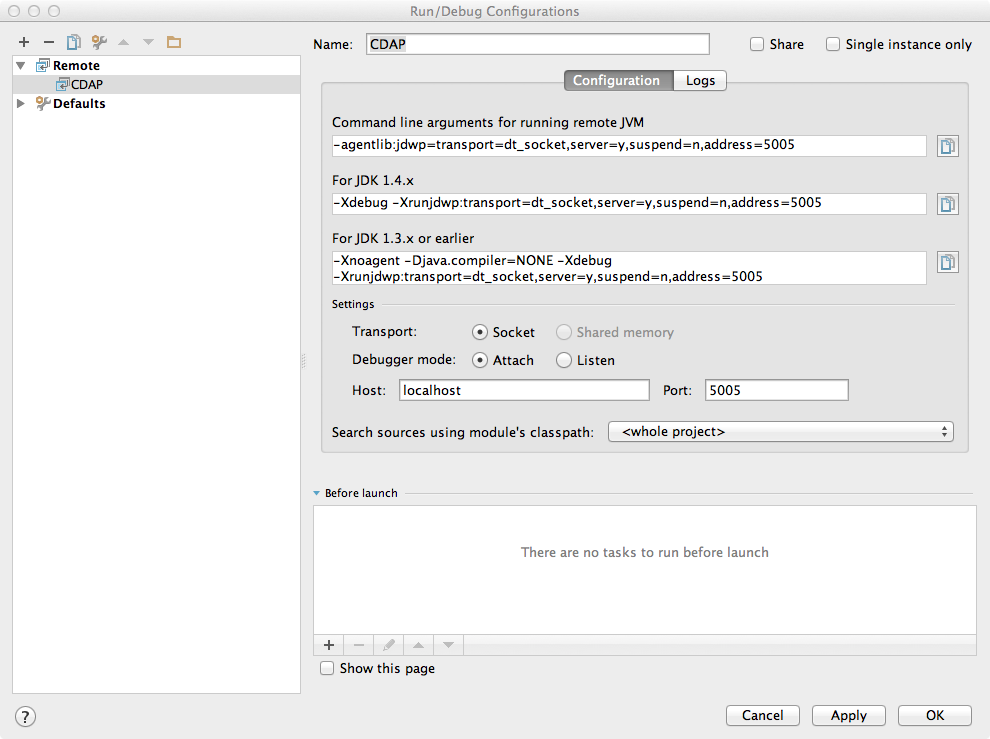
Create a debug configuration by entering a name, for example, CDAP.
In the Host field, type the host name, for example, localhost or node-1003.my.cluster.net.
In the Port field, type the debugging port, for example, 5005:

To start the debugger, click Run > Debug > CDAP.
Set a breakpoint in any code block.

Start the program in the CDAP UI.
Perform an operation that will execute the method. The control will stop at the breakpoint and you can proceed with debugging.
Debugging with Eclipse
Note: These instructions were developed with Eclipse IDE for Java Developers v4.4.0. You may need to adjust them for your installation or version. |
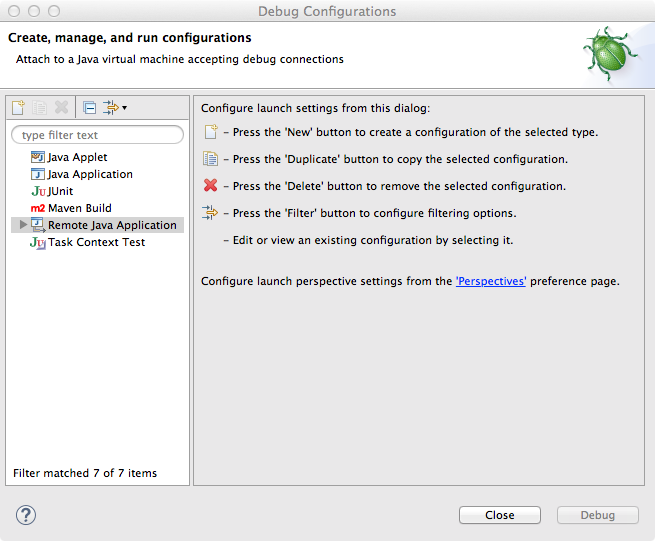
In Eclipse, click Run > Debug configurations.
To create a new launch configuration, in the list on the left of the window, double-click Remote Java Application.

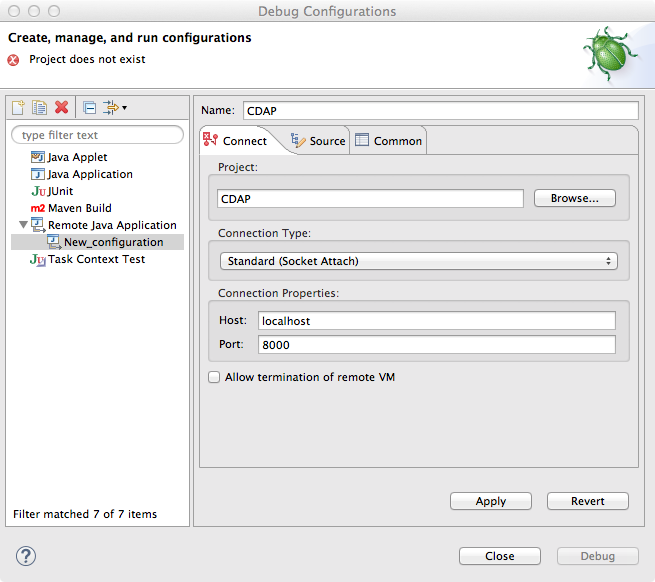
Enter a name and project, for example, CDAP.

In the Host field, type the host name, for example, localhost or node-1003.my.cluster.net.
In the Port field, type the debugging port, for example, 5005.
To start the debugger, in your project, click Debug.
Set a breakpoint in any code block.

Start the program in the CDAP UI.
Perform an operation that will execute the method. The control will stop at the breakpoint and you can proceed with debugging.
Debugging the Transaction Manager (Advanced Use)
In this advanced use section, we will explain in depth how transactions work internally. Transactions are introduced in the Transaction System.
A transaction is defined by an identifier, which contains the timestamp, in milliseconds, of its creation. This identifier, also called the write pointer, represents the version that this transaction will use for all of its writes. It is also used to determine the order between transactions. A transaction with a smaller write pointer than another transaction must have been started earlier.
The Transaction Manager (or TM) uses the write pointers to implement Optimistic Concurrency Control by maintaining state for all transactions that could be facing concurrency issues.
Transaction Manager States
The state of the TM is defined by these structures and rules:
The in-progress set, which contains all the write pointers of transactions which have neither committed nor aborted.
The invalid set, which contains the write pointers of the transactions considered invalid, and which will never be committed. A transaction becomes invalid only if either it times out or, for a long-running transaction, it is being aborted.
A transaction's write pointer cannot be in the in-progress set and in the invalid set at the same time.
The invalid set and the in-progress set together form the excluded set. When a transaction starts, a copy of this set is given to the transaction so that it excludes from its reads any writes performed by transactions in that set.
The committing change sets, which map write pointers of the transactions which have requested to commit writes and which have passed a first round of conflict check to a list of keys in which they have performed those writes.
The committed change sets, which has the same structure as the committing change sets, but where the write pointers refer to transactions which are already committed and which have passed a second round of conflict check.
Transaction Lifecycle States
Here are the states a transaction goes through in its lifecycle:
When a transaction starts, the TM creates a new write pointer and saves it in the in-progress set. A copy of the current excluded set is given to the transaction, as well as a read pointer. The pointer is an upper bound for the version of writes the transaction is allowed to read. It prevents the transaction from reading committed writes performed after the transaction started.
The transaction then performs writes to one or more rows, with the version of those writes being the write pointer of the transaction.
When the transaction wants to commit writes, it passes to the TM all the keys where those writes took place. If the transaction is not in the excluded set, the TM will use the committed change sets structure to detect a conflict. A conflict happens in cases where the transaction tries to modify a row which, after the start of the transaction, has been modified by one of the transactions present in the structure.
If there are no conflicts, all the writes of the transaction along with its write pointer are stored in the committing change sets structure.
The client, such as a dataset, can then ask the TM to commit the writes. These are retrieved from the committing change sets structure. Since the committed change sets structure might have evolved since the last conflict check, another one is performed. If the transaction is in the excluded set, the commit will fail regardless of conflicts.
If the second conflict check finds no overlapping transactions, the transaction's write pointer is removed from the in-progress set, and it is placed in the committed change sets structure, along with the keys it has written to. The writes of this transaction will now be seen by all new transactions.
If something went wrong in one or other of the committing steps, we distinguish between normal and long-running transactions:
For a normal transaction, the cause could be that the transaction was found in the excluded set or that a conflict was detected. The client ensures rolling back the writes the transaction has made, and it then asks the TM to abort the transaction. This will remove the transaction's write pointer from either the in-progress set or the excluded set, and optionally from the committing change sets structure.
For a long-running transaction, the only possible cause is that a conflict was detected. Since it is assumed that the writes will not be rolled back by the client, the TM aborts the transaction by storing its write pointer into the excluded set. It is the only way to make other transactions exclude the writes performed by this transaction.
The committed change sets structure determines how fast conflict detections are performed. Fortunately, not all the committed writes need to be remembered; only those which may create a conflict with in-progress transactions. This is why only the writes committed after the start of the oldest, in-progress, not-long-running transaction are stored in this structure, and why transactions which participate in conflict detection must remain short in duration. The older they are, the bigger the committed change sets structure will be and the longer conflict detection will take.
When conflict detection takes longer, so does committing a transaction and the transaction stays longer in the in-progress set. The whole transaction system can become slow if such a situation occurs.
Dumping the Transaction Manager
CDAP comes bundled with a script that allows you to dump the state of the internal transaction manager into a local file to allow further investigation. If your CDAP Instance tends to become slow, you can use this tool to detect the incriminating transactions. This script is called cdap debug transactions (on Windows, it is tx-debugger.bat).
To download a snapshot of the state of the TM of the CDAP, use the command:
$ cdap debug transactions view --host <name> [--save <filename>] |
|
> tx-debugger.bat view --host <name> [--save <filename>] |
|
where name is the host name of your CDAP instance, and the optional filename specifies where the snapshot should be saved. This command will print statistics about all the structures that define the state of the TM.
You can also load a snapshot that has already been saved locally with the command:
$ cdap debug transactions view --filename <filename> |
|
> tx-debugger.bat view --filename <filename> |
|
where filename specifies the location where the snapshot has been saved.
Here are options that you can use with the tx-debugger view commands:
Use the --ids option to print all the transaction write pointers that are stored in the different structures.
Use the --transaction <writePtr> option to specify the write pointer of a transaction you would like information on. If the transaction is found in the committing change sets or the committed change sets structures, this will print the keys where the transaction has performed writes.
While transactions don't inform you about the tasks that launched them, whether it was a Spark or MapReduce program, you can match the time they were started with the activity of your CDAP to track potential issues.
If you really know what you are doing and you spot a transaction in the in-progress set that should be in the excluded set, you can use this command to invalidate it:
$ cdap debug transactions invalidate --host <name> --transaction <writePtr> |
|
> tx-debugger.bat invalidate --host <name> --transaction <writePtr> |
|
Invalidating a transaction when we know for sure that its writes should be invalidated is useful, because those writes will then be removed from the concerned Tables.
