Overview
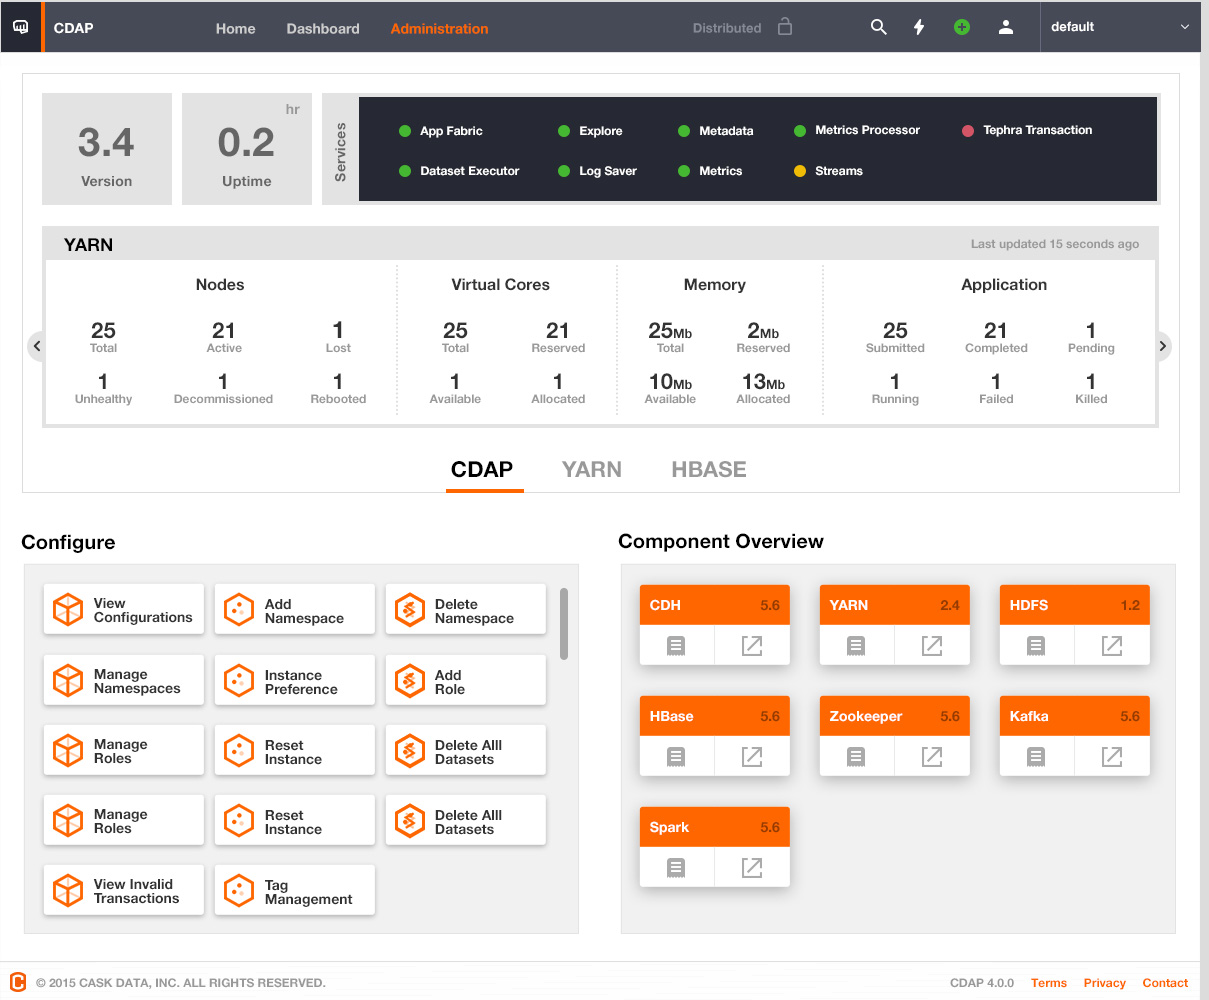
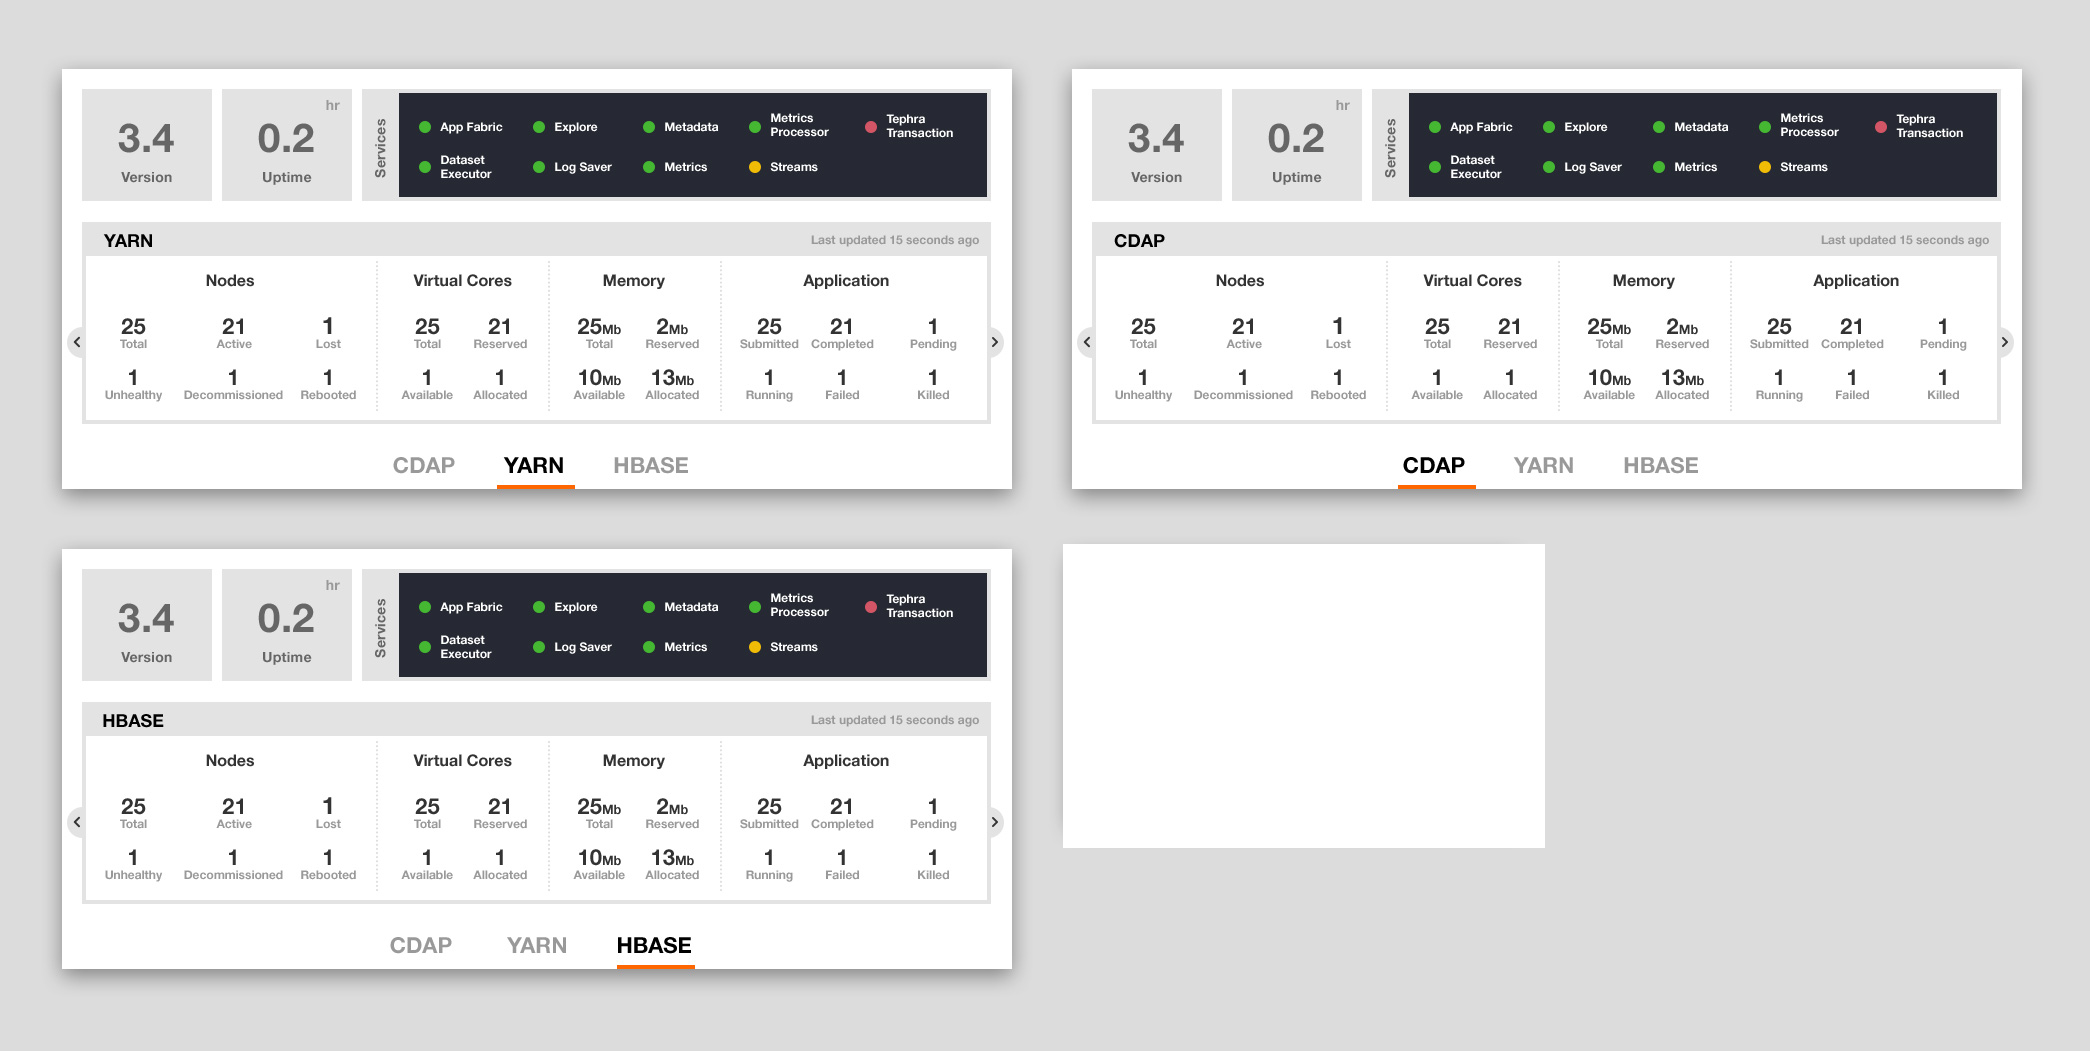
The CDAP 4.0 UI is designed to provide operational insights about both - CDAP services as well as other service providers such as YARN, HBase and HDFS. The CDAP platform will need to expose additional APIs to surface this information.
Requirements
The operational APIs should surface information for the Management Screen
These designs translate into the following requirements:
- CDAP Uptime
- P1: Should indicate the time (number of hours, days?) for which the CDAP Master process has been running.
- P2: In an HA environment, it would be nice to indicate the time of the last master failover.
- CDAP System Services:
- P1: Should indicate the current number of instances.
- P1: Should have a way to scale services.
- P1: Should show service logs
- P2: Node name where container started
- P2: Container name
- P2:
master.servicesYARN application name
- Middle Drawer:
- CDAP:
- P1: # of masters, routers, kafka-servers, auth-servers
- P1: Router requests - # 200s, 404s, 500s
- P1: # namespaces, artifacts, apps, programs, datasets, streams, views
- P1: Transaction snapshot summary (invalid, in-progress, committing, committed)
- P1: Logs/Metrics service lags
- P2: Last GC pause time
- HDFS:
- P1: Space metrics: yotal, free, used
- P1: Nodes: yotal, healthy, decommissioned, decommissionInProgress
- P1: Blocks: missing, corrupt, under-replicated
- YARN:
- P1: Nodes: total, new, running, unhealthy, decommissioned, lost, rebooted
- P1: Apps: total, submitted, accepted, running, failed, killed, new, new_saving
- P1: Memory: total, used, free
- P1: Virtual Cores: total, used, free
- P1: Queues: total, stopped, running, max_capacity, current_capacity
- HBase
- P1: Nodes: total_regionservers, live_regionservers, dead_regionservers, masters
- P1: No. of namespaces, tables
- P2: Last major compaction (time + info)
- Zookeeper: Most of these are from the output of
echo mntr | nc localhost 2181- P1: Num of alive connections
- P1: Num of znodes
- P1: Num of watches
- P1: Num of ephemeral nodes
- P1: Data size
- P1: Open file descriptor count
- P1: Max file descriptor count
- Kafka
- JMX Metrics that Kafka exposes: https://kafka.apache.org/documentation#monitoring
- P1: # of topics
- P1: Message in rate
- P1: Request rate
- P1: # of under replicated partitions
- P1: Partition counts
- Sentry
- P1: # of roles
- P1: # of privileges
- P1: memory: total, used, available
- P1: requests per second
- any more?
- KMS
- CDAP:
- Component Overview
- P1: YARN, HDFS, HBase, Zoookeeper, Kafka, Hive
- P1: For each component: version, url, logs_url
- P2: Sentry, KMS
- P2: Distribution info
- P2: Plus button - to store custom components and version, url, logs_url for each.
Design
Data Sources
Versions
- CDAP -
co.cask.cdap.common.utils.ProjectInfo - HBase -
co.cask.cdap.data2.util.hbase.HBaseVersion - YARN -
org.apache.hadoop.yarn.util.YarnVersionInfo - HDFS -
org.apache.hadoop.util.VersionInfo - Zookeeper - No client API available. Will have to build a utility around
echo stat | nc localhost 2181 - Hive -
org.apache.hive.common.util.HiveVersionInfo
URL
- CDAP -
$(dashboard.bind.address) + $(dashboard.bind.port) - YARN -
$(yarn.resourcemanager.webapp.address) - HDFS -
$(dfs.namenode.http-address) - HBase - hbaseAdmin.getClusterStatus().getMaster().toString()
HDFS
DistributedFileSystem - For HDFS statistics
YARN
YarnClient - for YARN statistics and info
HBase
HBaseAdmin - for HBase statistics and info
Kafka
JMX
Reference: https://github.com/linkedin/kafka-monitor
Zookeeper
Option 1: Four letter commands - mntr. Drawbacks: mntr was introduced in 3.5.0 - users may be running older versions of Zookeeper
Option 2: Zookeeper also exposes JMX - https://zookeeper.apache.org/doc/trunk/zookeeperJMX.html
HiveServer2
TBD
Sentry
JMX
The following is available by enabling the sentry web service (ref: http://www.cloudera.com/documentation/enterprise/latest/topics/sg_sentry_metrics.html) and querying for metrics (API: http://[sentry-service-host]:51000/metrics?pretty=true).
KMS
KMS also exposes JMX via the endpoint http://host:16000/kms/jmx.
REST API
The following REST APIs will be exposed from app fabric.
Info
Path
/v3/system/serviceproviders/info
Output
{
  "hdfs": {
    "version": "2.7.0",
    "url": "http://localhost:50070",
    "url": "http://localhost:50070/logs/"
  },
  "yarn": {
    "version": "2.7.0",
    "url": "http://localhost:8088",
    "logs": "http://localhost:8088/logs/"
  },
  "hbase": {
    "version": "1.0.0",
    "url": "http://localhost:50070",
    "logs": "http://localhost:60010/logs/"
  },
  "hive": {
    "version": 1.2
  },
  "zookeeper": {
    "version": "3.4.2"
  },
  "kafka": {
    "version": "2.10"
  }
}
Statistics
Path
/v3/system/serviceproviders/statistics
Output
 {
  "cdap": {
    "masters": 2,
    "kafka-servers": 2,
    "routers": 1,
    "auth-servers": 1,
    "namespaces": 10,
    "apps": 46,
    "artifacts": 23,
    "datasets": 68,
    "streams": 34,
    "programs": 78
  },
  "hdfs": {
    "space": {
      "total": 3452759234,
      "used": 34525543,
      "available": 3443555345
    },
    "nodes": {
      "total": 40,
      "healthy": 36,
      "decommissioned": 3,
      "decommissionInProgress": 1
    },
    "blocks": {
      "missing": 33,
      "corrupt": 3,
      "underreplicated": 5
    }
  },
  "yarn": {
    "nodes": {
      "total": 35,
      "new": 0,
      "running": 30,
      "unhealthy": 1,
      "decommissioned": 2,
      "lost": 1,
      "rebooted": 1
    },
    "apps": {
      "total": 30,
      "submitted": 2,
      "accepted": 4,
      "running": 20,
      "failed": 1,
      "killed": 3,
      "new": 0,
      "new_saving": 0
    },
    "memory": {
      "total": 8192,
      "used": 7168,
      "available": 1024
    },
    "virtualCores": {
      "total": 36,
      "used": 12,
      "available": 24
    },
    "queues": {
      "total": 10,
      "stopped": 2,
      "running": 8,
      "maxCapacity": 32,
      "currentCapacity": 21
    }
  },
  "hbase": {
    "nodes": {
      "totalRegionServers": 37,
      "liveRegionServers": 34,
      "deadRegionServers": 3,
      "masters": 3
    },
    "tables": 56,
    "namespaces": 43
  }
}
Sentry
TODO: CDAP Master Uptime?
Caching
It is not possible to hit HBase/YARN/HDFS for every request from the UI. As a result, the result of the statistics API will have to be cached, with a configurable timeout. Details TBD.

