...
Any CDAP application can be debugged in the CDAP Sandbox by attaching a remote debugger to the CDAP JVM. To enable remote debugging:
Start the CDAP Sandbox with
--enable-debug, optionally specifying a port (default is5005).The CDAP should confirm that the debugger port is open with a message such as
Remote debugger agent started on port 5005.Deploy (for example) the SportResults application to the CDAP by dragging and dropping the
SportResults.jarfile from the/examples/SportResultsdirectory onto the CDAP UI.Open the SportResults application in an IDE and connect to the remote debugger.
For more information, see Attaching a Debugger.
...
| Code Block |
|---|
POST /v3/namespaces/default/apps/WordCount/spark/WordCounter/debug
|
Using curl:
| Expand | ||
|---|---|---|
| ||
|
...
| Code Block |
|---|
{
  "app": "WordCount",
  "containers": [
    {
      "container": "container_1397069870124_0010_01_000002",
      "debugPort": 42071,
      "host": "node-1004.my.cluster.net",
      "instance": 0,
      "memory": 512,
      "name": "unique",
      "virtualCores": 1
    },
    ...
    {
      "container": "container_1397069870124_0010_01_000005",
      "debugPort": 37205,
      "host": "node-1003.my.cluster.net",
      "instance": 0,
      "memory": 512,
      "name": "splitter",
      "virtualCores": 1
    }
  ],
  "id": "WordCounter",
  "runtime": "distributed",
  "type": "spark",
  "yarnAppId": "application_1397069870124_0010"
}
|
You see the YARN application id and the YARN container IDs, but more importantly, you can see the host name and debugging port. For example, for one of the containers, you see the host is node-1003.my.cluster.net and the debugging port is 37205. You can now attach your debugger to the container’s JVM
...
| Code Block |
|---|
POST /v3/namespaces/default/apps/WordCount/services/RetrieveCounts/debug
GET /v3/namespaces/default/apps/WordCount/services/RetrieveCounts/live-info
|
Analysis of the response would give you the host names and debugging ports for all instances of the service.
...
| Info |
|---|
Note: These instructions were developed with IntelliJ v13.1.2. You may need to adjust them for your installation or version. |
From the IntelliJ toolbar, select Run > Edit Configurations.
Click + and choose Remote:
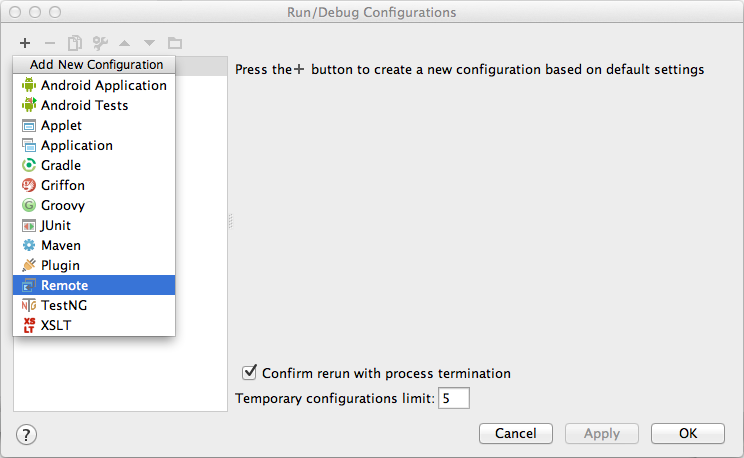
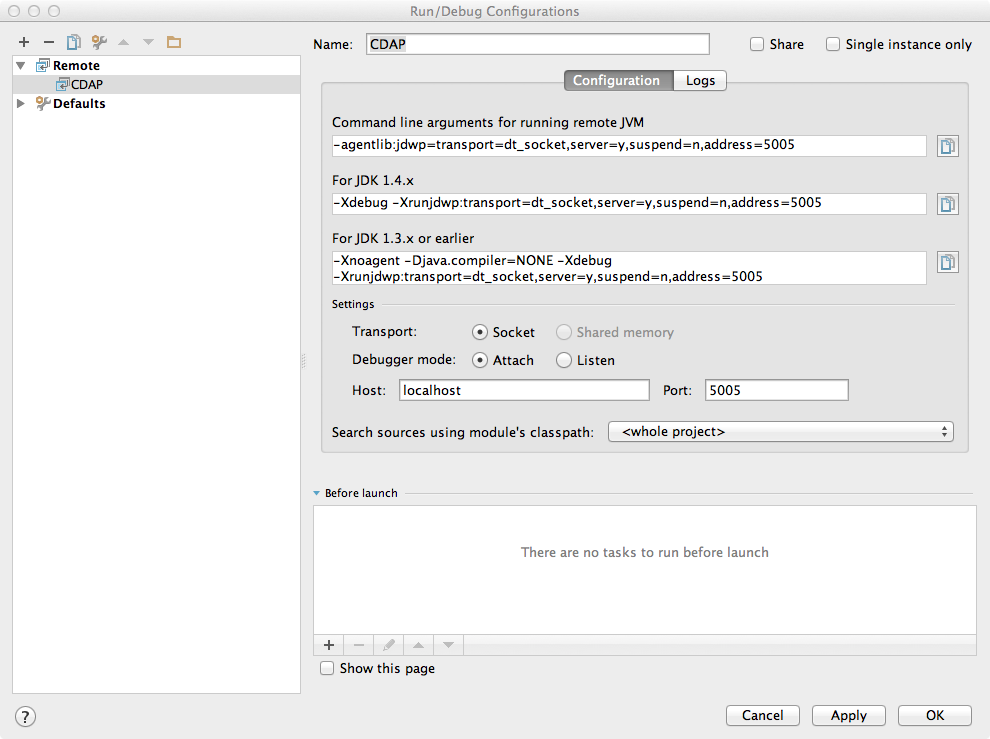
Create a debug configuration by entering a name, for example,
CDAP.In the Host field, type the host name, for example,
localhostornode-1003.my.cluster.net.In the Port field, type the debugging port, for example, 5005:
To start the debugger, click Run > Debug > CDAP.
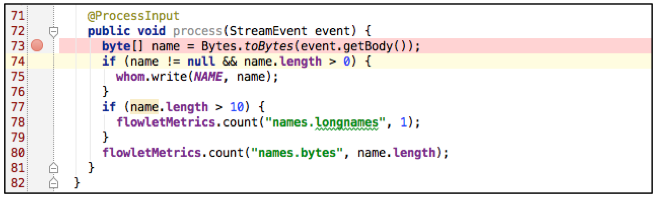
Set a breakpoint in any code block.
Start the program in the CDAP UI.
Perform an operation that will execute the method. The control will stop at the breakpoint and you can proceed with debugging.
Debugging with Eclipse
| Info |
|---|
Note: These instructions were developed with Eclipse IDE for Java Developers v4.4.0. You may need to adjust them for your installation or version. |
In Eclipse, click Run > Debug configurations.
To create a new launch configuration, in the list on the left of the window, double-click Remote Java Application.
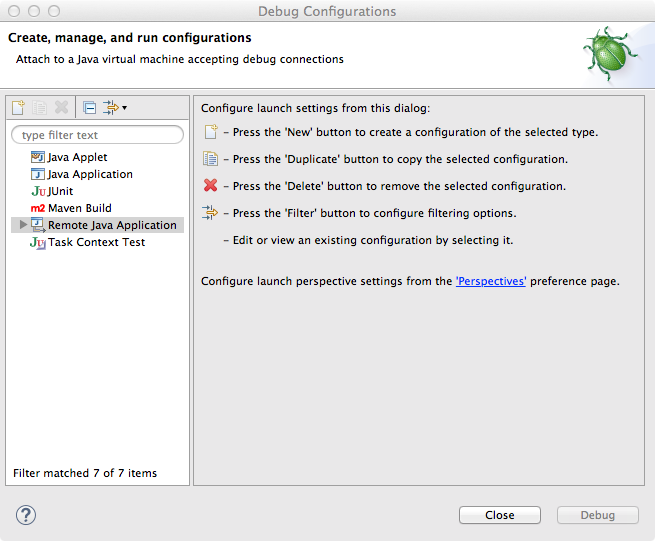
Enter a name and project, for example, CDAP.
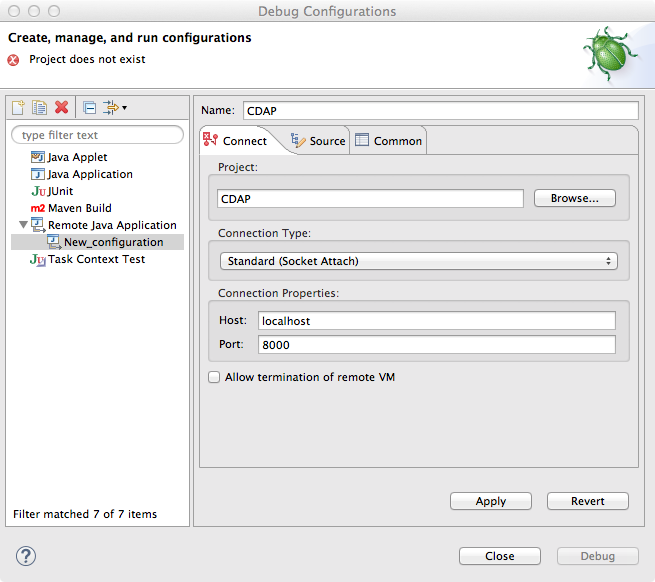
In the Host field, type the host name, for example,
localhostornode-1003.my.cluster.net.In the Port field, type the debugging port, for example,
5005.To start the debugger, in your project, click Debug.
Set a breakpoint in any code block.
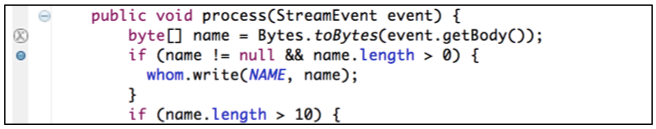
Start the program in the CDAP UI.
Perform an operation that will execute the method. The control will stop at the breakpoint and you can proceed with debugging.
Debugging the Transaction Manager (Advanced Use)
...